
While founders treat ARR as proof of growth. Investors treat it as something to dissect. This issue breaks down how expansion revenue can hide contraction, why high logo retention can still mean decline, and how a flawed ARR structure erased $39M in valuation during diligence. Learn how to build a clean ARR bridge, track real Net Revenue Retention, and avoid costly reporting mistakes in global and Africa-focused SaaS markets.
Founders walk into a Series B data room with a clean headline number and a confident handshake. They believe the ARR proves the story. Investors believe the ARR hides it.
The gap between those two beliefs costs companies $39 million in a single week of diligence. It is not a theory. It is a documented event in the Canada–Africa corridor—and it is being repeated across growth-stage companies that have confused revenue reporting with revenue intelligence.
From The Operator’s Desk
Case in Point: Late 2024. A Toronto-based enterprise HR technology firm reached $18.3M ARR with 97% logo retention. Series B term sheet landed at $110M. Leadership celebrated. The data room opened.
What Broke:
Expansion ARR Illusion: $4.1M labeled as “expansion” wasn’t growth. It was replacement. Customers upgraded but quietly dropped old features. It looked like progress, but the core product was shrinking 16% each year.
Logo Retention Trap: 97% retention looks strong. It isn’t. Customers stayed but spent less. Fewer seats. Smaller plans. The company kept clients but lost their money.
NRR Blindspot: Leadership thought NRR was above 110%. It wasn’t. Real NRR was 84% after cleaning the data. Below 100% means you must win new customers just to stay flat.
The Reality:
ARR wasn’t $18.3M. It was $15.7M. The investor didn’t argue. They reset the value of the company.
The Outcome:
Valuation dropped from $110M to $71M. $39M gone. The team spent 90 days fixing their numbers before talking to any investor again.
The Lesson:
The investors did not discover fraud. They discovered a failed Revenue Operations architecture where the CRM was recording expansions without reconciling cancellations on the same account. 58% of RevOps teams report this exact “dirty data” problem—and it creates the mirage automatically. The consequence is not automatic.
The Evidence Stack
84%: Actual NRR of the Toronto firm once replacement revenue was stripped from “Expansion ARR”
63%: Valuation premium commanded by SaaS companies with NRR above 120% over the market median—the top tier posts a median 9.3x EV/Revenue multiple while sub-100% peers trade near 1.2x
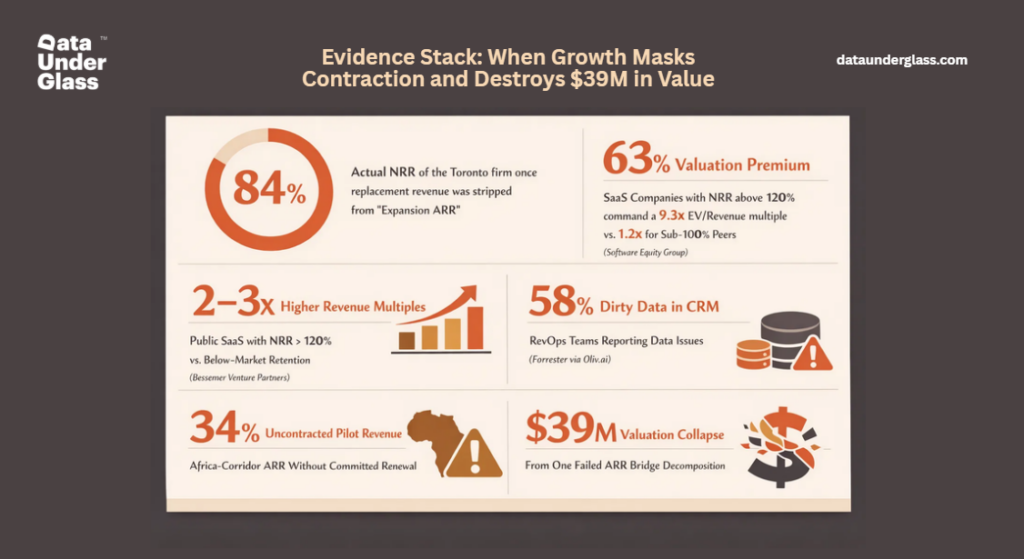
2–3x: Higher revenue multiples for public SaaS companies with NRR above 120% versus those with below-market retention, per Bessemer Venture Partners
58%: Share of RevOps teams reporting “dirty data” problems in their CRM—the root cause of most ARR misreporting, not intentional fraud
34%: Estimated share of Africa-corridor ARR that is actually uncontracted pilot revenue with no committed renewal
$39M: Single-week valuation collapse from one failed ARR Bridge decomposition
Flagship Insight: The ARR Bridge Decomposition
Investors do not look at your ARR number. They decompose it into seven components, and they look for the decay hiding between them.
The Seven Components:
- Beginning ARR — Your starting baseline.
- New Business ARR — Revenue from net new logos.
- Expansion ARR — Upsells and seat additions from existing clients.
- Reactivation ARR — Revenue from customers who previously churned and returned.
- Contraction ARR — Clients who downgraded or reduced seats.
- Churn ARR — Clients who cancelled entirely.
- Price/FX Adjustments — Shifts from pricing changes or currency movement.
The most common failure: Expansion masks Contraction. A company reports $1M in net new ARR. Underneath: $2.5M in expansion from a new add-on feature is barely covering $1.5M in contraction from the core product. The original value proposition is dying. The headline number does not show it.
If you cannot present all seven components without a spreadsheet emergency, your next investor will find the rot before you do.
You may also enjoy reading: Why Founder-Led Sales Scales Revenue, and Then Destroys It
The African Reality: Two Specific Killers
1. The Pilot Mirage: In Nigeria, Kenya, and South Africa, big companies use pilots to test vendors. There is no promise they will continue. About 34% of ARR in Africa-focused companies comes from these pilots but gets reported as recurring revenue. It isn’t. It’s a cost.
What matters is simple: pilot-to-contract conversion rate. If you run 50 pilots and only 28% convert, you are not growing. You are burning time, money, and team energy on deals that will never pay off.
2. Currency Illusion: Many startups earn in Naira or Shillings but report to their board in CAD or USD. Here’s the trap: your local revenue can grow 50%, but once converted, your ARR is flat or even shrinking. Investors break this into three parts:
- Real local growth
- FX loss
- Cash you can actually move
If you don’t show this clearly, it looks like you’re hiding something. And once trust is gone, the deal is already dead.
What’s Actually Working
1. Run the ARR Bridge Before Your Investor Does: Map every dollar from Beginning ARR to Ending ARR using all seven components. Do it quarterly. If Contraction is growing faster than Expansion, that is your primary strategic problem, not pipeline.
2. Replace Logo Retention with Revenue Retention: Present Gross Revenue Retention (GRR) and Net Revenue Retention (NRR) as separate numbers. GRR shows your floor, how much you keep if no one expands. NRR shows your engine, whether existing customers are growing. A board that only sees logo retention is watching the wrong metric.
3. Create a Pilot-to-Contract Pipeline for African Markets: Treat every pilot as a cost centre, not a revenue line. Track conversion rate, not pilot count. Only converted multi-year committed contracts enter your ARR. Everything else is pipeline.
Steal This: The ARR Mirage Audit
1. Decompose Your Last Quarter: Pull your ARR bridge for Q4 2025. Separate expansion from replacement. If any “expansion” contract replaced a cancelled feature or tier, reclassify it as contraction. Your real NRR is what remains.
2. Run the 90-Day Zero Test: If your largest three customers gave notice tomorrow, what is your cash runway? What does your real ARR become? If the answer is existential, you are not running a diversified SaaS business, you are a managed service contract.
3. Map Every African Pilot: List all pilot agreements active in African markets. Calculate conversion rate. If below 40%, you have an operational burden masquerading as market traction.
4. GAAP-to-ARR Reconciliation: Can every dollar of your reported ARR be traced to an invoice in your billing system and a cash deposit in your bank? If there is a gap between booked ARR and recognized revenue, your data room will collapse.
Field Intelligence
Signal:
- A 10-point NRR improvement, from 110% to 120%, can add 20–30% to valuation, often worth tens of millions before a single new logo is added
- 76% of organizations report that less than half their CRM data is accurate and complete, meaning most ARR reporting is built on a foundation that would not survive diligence
- Investors decompose African ARR into local growth, FX impact, and realized ARR, founders who surface this first win trust immediately
Noise:
- 97% logo retention as the headline churn narrative
- Counting uncontracted pilot revenue as ARR in African market decks
- Presenting a single ARR number without bridge decomposition in any data room above $10M
The Bottom Line
Your ARR is a snapshot. Investors are watching the full film.
The snapshot says $18.3M and 97% retention. The film shows a core product shrinking 16% each year, “expansion” hiding losses, and an NRR of 84% that means you’re running just to stay in place.
The reality: While you polish headline numbers, investors break them apart. They build the full ARR bridge, find the weak spots, and see the decline before you finish your first slide.
The hard truth: If you don’t track contraction separately from churn, you’re not running a business. You’re managing a very expensive misunderstanding.